The Inertia Innovation Index that IDEO validated for us
Bernardo Torres - 2026-05-06
The Inertia Innovation Index that IDEO just validated for us
IDEO just published the report that we at Uncommon had been wanting to write for months
IDEO just published its first Innovation Quotient. There are few firms worth reading with full attention. IDEO is one of them.
For almost 50 years they put an idea on the map that we take for granted today: that innovation is not a department, it's a human-centered way of operating. Before IDEO, "design thinking" didn't exist as corporate vocabulary. Today it's common language in every serious corporation in the world.
In the IDEO report we found validation for the central message we've been taking to our clients for years.
When a firm with 50 years of work confirms what you've been saying for many years, it's not competition. It's validation.
The five macro insights that matter from the IDEO IQ
The report has many findings. These five are the ones worth the conversation:
1. Culture predicts the future better than financials. Companies in the upper range of the IDEO IQ report almost three times the revenue growth of the lower range. $18B against $5B in annual profit. Their leaders are six times more likely to believe they're better positioned than their competitors for the future. Internal culture is the most reliable leading indicator that exists.
2. Calling yourself customer-centric is free. Operating as such, almost nobody. 58% of companies declare themselves customer-centric (Resonance). But only 21% test early versions with real users. Declarative centricity is already a powerpoint tagline. Operational is what differentiates.
3. The behaviors that most predict performance are the hardest to build. Perspective (anticipating trends by looking outside the sector), Ownership (autonomy without going through layers) and Experimentation (prototyping with real clients). Precisely the three most predictive are the three lowest: 31%, 29% and 21% respectively.
4. Vision without speed, or speed without vision, doesn't cut it. Companies that combine both (the Drivers) generate double the profits of the rest. 87.5% of their leaders believe they'll prosper the next decade, versus 36% of the average. Both things, together, are the difference.
5. Successful AI adoption is an outcome of culture, not a strategy in itself. Only 41% of companies say they've successfully adopted AI to serve the customer. But among the Drivers, the figure rises to 52%. And those who use it to increase profits are almost double the average. The differentiator isn't the technology, it's the organizational architecture that receives it.
Where we agree with IDEO
A lot. More than it seems.
We agree that culture predicts future performance better than last quarter's financials. They say it with aggregated data, we say it case by case, and with a proprietary practice www.powertothepeople.com.mx The conclusion is the same: the P&L tells you who survived, culture tells you who's going to survive.
We agree that calling yourself customer-centric is free and operating as such is expensive. IDEO found the gap between the 58% that declares itself and the 21% that tests. We see it every time we reconstruct the trajectory of a real opportunity: the customer appears in the decks but not in the decisions.
We agree that the most predictive behaviors are the most underdeveloped. IDEO names them Perspective, Ownership and Experimentation. We see exactly the same thing on the floor: organizations invest in long-term planning, in good empowerment practices, in agile methodologies, and still struggle to make them operate. It's not lack of intention, it's excess friction.
We agree that AI adoption is an outcome of culture, not a strategy in itself. IDEO demonstrates it with data: companies with the best combination of vision and speed are doubling the average AI results. We say it more bluntly: if your organization has high internal friction, putting AI into that architecture will produce the same theater, just faster and more expensive.
This isn't coincidence. It's that the problem is real, and two firms that look at it honestly from different angles arrive at the same diagnosis.
When two honest people look at the same problem from different angles and arrive at the same conclusion, the problem stops being opinion.

Where our stance is different
If we differ from IDEO at all, it's not in the what. It's in the how.
There's another subtle but important difference: IDEO speaks to the leader as if they wanted to improve. It gives them a map with good practices and a hopeful conclusion.
At Uncommon we start from a different assumption: most leaders who read this type of report already know something is broken. They don't need another map. They need permission to name it out loud and they need someone from the outside who dares to tell them where the leak is, without fear of not being invited to the next meeting.
That's why the Inertia Innovation Index (I³) isn't measured with a survey. It's measured case by case. With the willingness to do the honest reconstruction, without protecting anyone's ego, starting with whoever is measuring it.
The map is for understanding. The mirror is for acting. Whoever confuses one with the other stays in the report.
The Inertia Innovation Index (I³)
At Uncommon we named the distance between the value of an opportunity when it's born and the value it delivers to the market. We call it the Inertia Innovation Index. The I³.
In most corporations, the result is embarrassing. Not because people are bad, but because the system was designed to look rigorous and ended up being slow. And slow, in innovation, isn't a virtue. It's the cause of death.
We identified five specific places where opportunity evaporates. These aren't hypotheses. They're patterns we saw repeat themselves in banks, retail, FMCG and innovation organizations over more than a decade:
The consensus filter. The opportunity survives only if everyone agrees. What survives consensus is, by definition, what no one considered risky anymore. In other words: what's no longer an opportunity.
The benchmark trap. "Who else is doing it?" is the question that kills more innovation than any other in a boardroom. If someone else is already doing it, it's no longer an advantage. It's parity.
Process speed versus market speed. The internal process runs in quarters. The market runs in weeks. The friction between those two clocks is where serious bets die.
The doubt budget. Each hierarchical level applies a layer of "are you sure?" to the idea. After four levels, what reaches the market is an apologetic version of what it originally was.
The signer's ego. The final decision often doesn't respond to the opportunity. It responds to the position of who signs. And position rarely wants risk.
If your organization has three of these five layers active, your I³ is high. If it has all five, your I³ is critical, and what you call innovation is probably well-budgeted corporate theater full of post-its.
Consensus is the cemetery where opportunities come to die with honors.
The test
At Uncommon we built a three-question diagnostic. It's not a quiz. It doesn't take 20 minutes. It takes as long as it takes to answer three questions about your last real opportunity:
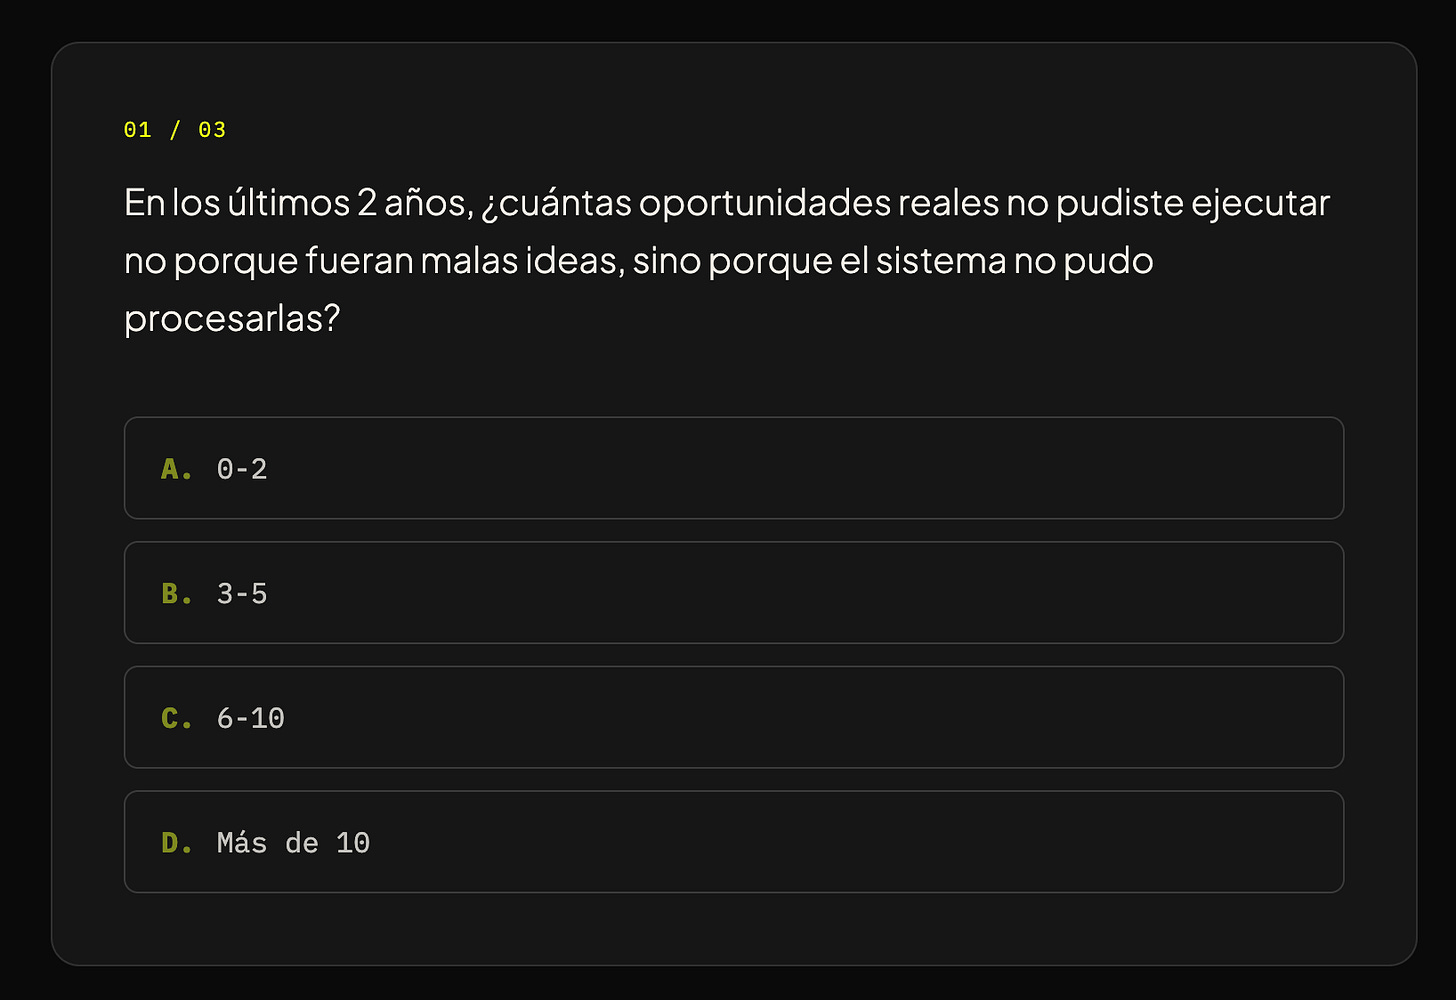


The three answers, together, give you your I³.
It's at noescomun.com/no-somos-para-todos. The conversation that follows the test lasts 30 minutes. No deck. No pitch. Just questions that make you uncomfortable.
Three questions, thirty minutes, one truth. If yours is comfort, there are many consultancies for that.
Why read both?
IDEO just put the aggregated photograph of the problem on the table. It's an enormous service to the global corporate innovation conversation. If you work in a large organization, it's worth every minute you spend on it.
At Uncommon we deliver the specific measurement tool. The instrument so your organization stops asking itself "are we in the 10% or the 90%?" and starts asking itself "how much real value are we losing this quarter, and exactly where?"
Both readings, together, are more useful than either one separately.
The IDEO report teaches you to read the forest. The I³ shows you which of your trees are already falling.
If your organization had to measure, today, the distance between the last opportunity it named internally and what it actually delivered to the market, what would it discover about itself that it prefers not to see?
And the question that follows, which is more important: who within the organization has the rank and the courage to make that measurement without protecting anyone's ego?
If the answer is "nobody," that's also a diagnosis.
Read the IDEO Innovation Quotient 2026 at ideo.com. Calculate your I³ at noescomun.com/no-somos-para-todos. If your I³ turns out high, you're not alone. You're in the 90% that IDEO already documented. The difference is that now you can start measuring how much it's costing you.